Saturday, 27 June 2026

The sea route offers a substantial reduction in logistics costs, estimated at Rs 13–20 per kg, compared to Rs 150–250 per kg through air shipment, making exports more viable for…
100 Startups from 22 States and 2 Union territories complete Export-Focused Acceleration Programme. The Agricultural and Processed Food Products Export Development Authority (APEDA), under the Ministry of Commerce & Industry,…
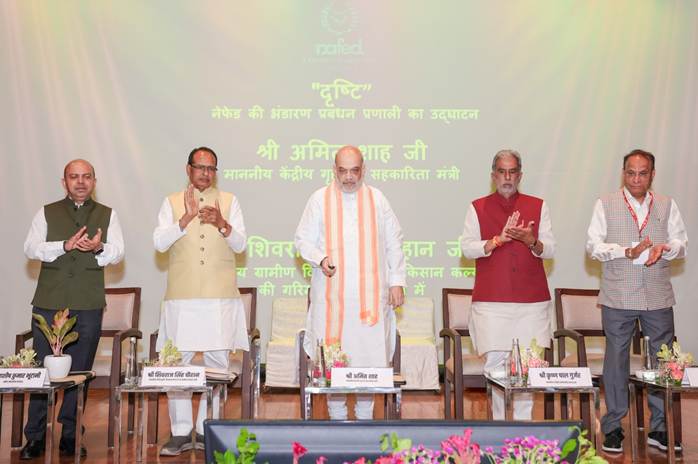
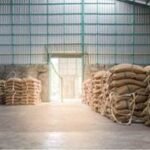
In the next two years, NCCF and NAFED will purchase every single grain of pulses directly from farmers which will ensure fair and remunerative prices for farmers, automatically increase the…

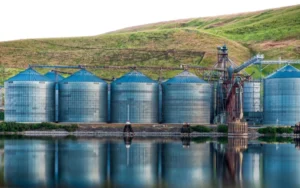
After weeks of disruption triggered by conflict in the Persian Gulf, a US-Iran ceasefire agreement is expected to revive fertiliser exports, restore shipping flows and stabilize global nutrient markets Global…

Exclusive to AgroSpectrum, Yashodhan Ramteke discusses why digital verification, farmer cooperatives, and equitable benefit sharing—not identical farming systems—will determine the success of climate finance In an exclusive interview with AgroSpectrum,…
US-India Research Alliance aims to revolutionize wheat and rice breeding with artificial intelligence, drones and advanced crop analytics As climate volatility intensifies pressure on global food systems, scientists are increasingly…
100 Startups from 22 States and 2 Union territories complete Export-Focused Acceleration Programme. The Agricultural and Processed Food Products Export Development Authority (APEDA), under the Ministry of Commerce & Industry,…
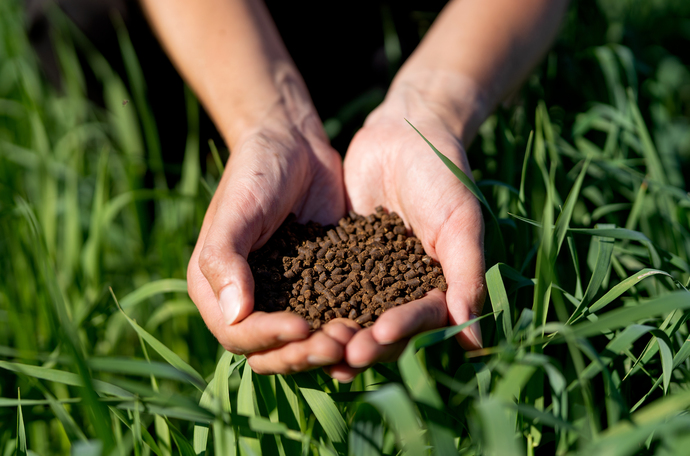
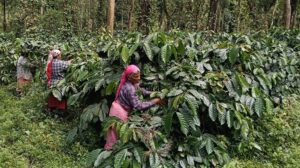
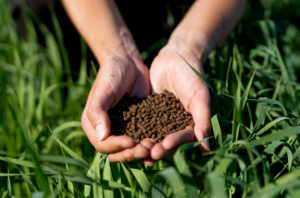
A multi-state Front Line Demonstration programme led by the The Solvent Extractors’ Association of India shows how regenerative agriculture can significantly boost mustard productivity, farmer profitability, and reduce import dependence…
ADB financing will support 5,700 smallholder coffee and cashew farmers in India and Viet Nam, linking market access and sustainability goals with climate resilience and certification support The Asian Development…
Healthy reservoir levels in North and Central India offset weak stocks in Southern and Eastern regions The latest Reservoir Storage Bulletin issued by the Central Water Commission (CWC) presents a…

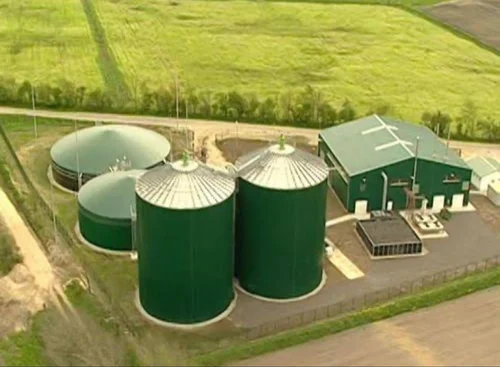
The development marks Kilburn Engineering’s entry into the qualified supplier base of Casale, a global technology licensor in the fertiliser, chemical and energy sectors. Kilburn Engineering Limited has secured its…
Record production of ammonia, urea and potash failed to ease market pressures as rising gas prices, export restrictions and weakening affordability heightened uncertainty ahead of the next crop season Global…
The 2025 report is structured around Yara’s localised 5Cs framework: Commit, Connect, Care, Concern, and Contribute. This framework aligns directly with the UN Sustainable Development Goals (SDGs) to address critical…

After weeks of disruption triggered by conflict in the Persian Gulf, a US-Iran ceasefire agreement is expected to revive fertiliser exports, restore shipping flows and stabilize global nutrient markets Global…